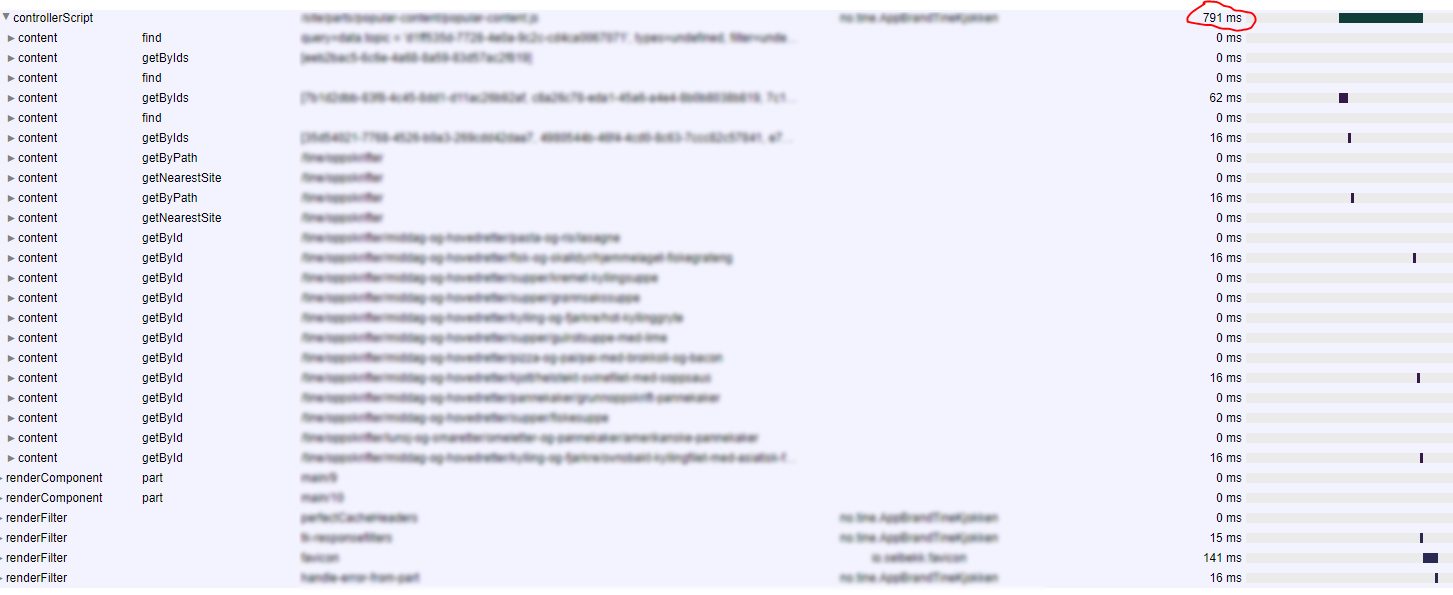
Been trying to debug som slow pages and found requsts were the trace times don’t add up
Like this rendering that’s supposed to take 791ms but only 250-ish are visible?
Been trying to debug som slow pages and found requsts were the trace times don’t add up
Like this rendering that’s supposed to take 791ms but only 250-ish are visible?
The total time is correct. Everything might not be traced Even if we try to. Is this from your development environment, or production?
This is in production. Trying to figure out what’s slowing down the page is hard if the traces are not detailed 
What does it look like on your development environment?
In development the numbers add up almost 100% on the simple tests I just made. This request is missing about 50ms
Hi Tommy!
The expanded view only lists the parts of the rendering that are acutally traced, as live trace is not a complete profiler, there might be holes in the tracing details from time to time. There are also known missing trace-points like multi-repo queries that will be fixed in future versions.